

A Working Capital Hub Fact Sheet
Working Capital Metrics and KPIs | Definition, Formula and Business Application
Author: Alexander Flach
Last updated: August 13, 2025
Want to download this article for free?
Create a free account to download the article today.
Introduction
Working capital is the lifeblood of a company’s operations. It determines whether the business can pay its bills, invest in growth, and withstand shocks. Yet, many companies struggle to measure and manage it effectively.
This guide explains the most important working capital metrics and KPIs — what they mean, how to calculate them, and how to use them to drive better decisions.
Whether you’re a finance leader, operations manager, or student of corporate finance, this page will give you:
- Clear definitions and formulas
- Examples and industry context
- Limitations and pitfalls to avoid
- Practical tips to interpret and act on results
Key Take Aways
- Working capital KPIs are essential tools for tracking a company’s cashflow, liquidity, efficiency, and resilience.
- Both working capital (broad liquidity view) and operating working capital (day-to-day operations view) should be measured.
- Context matters. Ratios mean little without considering industry, business model, company size, growth stage, seasonality, and trends over time.
- Trends matter more than snapshots. One reporting period can mislead; tracking direction over time reveals true performance.
- Balance sheet KPIs have limitations. They provide a helicopter view but can distort reality (averages, cut-off dates, mismatch with P&L). They must be supplemented with transaction-level data for actionable insights.
- KPIs must trigger action. The real value comes when finance and operations teams interpret the numbers, align around them, and make changes that release cash and improve resilience.
- The goal isn’t just reporting - it’s decision-making
Why Measure Working Capital?
In today’s competitive and unpredictable business environment, working capital management can make or break a company.
Rising capital costs, higher material prices, and ongoing supply chain disruptions all put pressure on liquidity.
Companies that track and optimize their working capital have the flexibility to adapt - those that don’t risk being caught off guard.
At its core, strong working capital management means using current assets and current liabilities as efficiently as possible. Done well, it ensures a business has enough liquidity to operate today, while still supporting tomorrow’s growth.
Working capital should be managed on three levels:
- Strategic: Does operating working capital align with the company’s long-term direction and generate the returns investors expect?
Example: A consumer goods company expanding into new markets needs to ensure inventory buildup doesn’t erode profitability.
- Tactical: Does working capital provide enough cash flow to meet short-term costs and obligations?
Example: A manufacturer must cover payroll and supplier bills even when customer payments are delayed.
- Operational: Does day-to-day management of receivables, payables, and inventory keep the business running smoothly?
Example: A wholesaler with fast-moving goods must balance inventory levels to avoid stockouts without overinvesting in stock.
The hallmark of good practice is finding the right balance between liquidity, profitability, and growth. To capture all three perspectives, companies must measure and manage both:
- Working Capital → overall liquidity
- Operating Working Capital (OWC) → efficiency of
day-to-day operations

Working Capital vs. Operating Working Capital
The terms working capital (WC) and operating working capital (OWC) are often used interchangeably, but they measure different aspects of liquidity and efficiency. Understanding the distinction is critical.
Working Capital (WC)
- Formula: WC = Current Assets – Current Liabilities
- Purpose: Provides a broad view of short-term liquidity - does the company have enough current assets to cover its current obligations?
- Includes: Current assets and current liabilities
- Limitation: Because WC includes financial components (like debt or taxes), it does not always reflect how efficiently a business is running its core operations.
Operating Working Capital (OWC)
- Formula: OWC = Operating Current Assets – Operating Current Liabilities
- Purpose: Focuses only on the “operational engine” — how much cash is tied up in receivables, inventory, and payables.
- Includes: Only the operating components of current assets and current liabilities (Inventory, accounts receivable, supplier prepayments, accounts payable, and customer prepayments).
- Benefit: Offers a clearer picture of how efficiently the company uses working capital in day-to-day business activities.
When to use each:
- Use Working Capital for assessing overall liquidity and when preparing financial statements for lenders, investors, or regulators. WC is like looking at the entire toolbox - everything you own that could, in theory, help you fix a problem.
- Use Operating Working Capital for operational decisions - e.g., negotiating supplier terms, tightening receivables, or optimizing inventory. OWC is like looking only at the tools you actually use every day - the ones that determine how quickly and effectively you can get the job done.
10 Common Working Capital Metrics and KPIs
1. Working Capital (WC)
The working capital metric tells if a company holds sufficient cash and cash equivalents to pay its short-term financial obligations. (Its liquidity):
- Too low working capital = liquidity risk
- Too high working capital = Idle capital
The formula for calculating working capital is:
Working Capital = Current Assets – Current Liabilities
Where:
Current Assets = Inventory + Accounts Receivable + Supplier Prepayments + Accrued Income + Other Current Assets + Cash
And:
Current Liabilities = Accounts Payable + Customer Prepayments + Current Debt + Tax Liabilities + Other Current Liabilities
2. Working Capital Ratio (Current Ratio)
The working capital ratio (also called the current ratio) is a measure of a company’s liquidity, calculated by dividing its current assets by its total liabilities.
The formula for calculating the working capital ratio is:
Working Capital Ratio = Current Assets / Current Liabilities
The working capital ratio helps illustrate how much of a company’s revenues will be used to meet payment obligations in the period.
And, consequently, it shows how much cash the company will have left for new opportunities such as financing growth or capital investments.
- A working capital ratio greater than 1 indicates that the company has more current assets than current liabilities.
- A ratio between 1.5 and 2 is generally considered good, as it suggests the company has sufficient funds on hand to facilitate its short-term debt and at the same time provide flexibility to finance growth and investments.
- A ratio greater than 3 can at the same time suggest that a company is not utilizing its assets effectively. Too high levels of idle capital indicate an inefficient use of resources.
However, the working capital ratio is by itself not a complete representation of a company’s short-term liquidity or longer-term solvency, as it at any time only provides a snapshot of performance.
Also, it does not consider the quality of current assets and includes items that may not be easily converted into cash, such as slow moving or obsolete inventories.
3. Quick Ratio (QR)
The quick ratio (also called acid-test ratio) is like the working capital ratio, a measure of a company’s liquidity.
It is however a more conservative measure as it excludes inventory from current assets, as inventories may not be as easily convertible to cash or may require substantial discounts to liquidate.
The formula for calculating the quick ratio is:
Quick Ratio = (Current Assets – Inventory) /Current Liabilities
The quick ratio provides a clearer picture of a company's ability to meet short-term obligations without relying on selling inventory. A higher cash ratio indicates a stronger ability to cover short-term liabilities.
4. Operating Working Capital (OWC)
The Operating Working Capital metric looks at how effectively a company utilizes the capital it has tied up in operations.
The formula for calculating operating working capital is:
Operating Working Capital = Operating Current Assets – Operating Current Liabilities
Where:
Operating Current Assets = Inventory + Accounts Receivable + Supplier Prepayments (+ accrued income)
And:
Operating Current Liabilities = Accounts Payable + Customer Prepayments
5. Operating Working Capital as % of sales (OWC%)
Operating working capital should always be evaluated in relation to the business it is supporting.
OWC divided by sales is therefore a common metric, showing how effectively a company can convert its invested operating working capital into sales.
The formula for calculating Operating Working Capital % is:
OWC% = OWC / Last 12 months Sales
This relative measurement is effective when following progress over time, visualizing a company’s aggregated operating working capital performance and its trend.
The higher the sales a company can generate from its operating working capital, the more efficient and effective it is.
It can also be used to benchmark against relevant peers. However, as always, benchmarks should be approached with caution, as it can be difficult finding relevant companies to compare to.
6. Return on Operating Working Capital (ROOWC)
This metric is a measure of how effective a company is in turning its invested capital into profits.
The formula for calculating ROOWC is:
ROWC = EBITDA / Operating Working Capital
At a minimum, a company’s return on operating working capital should be more than its cost of capital. If not, the company should look for better ways of generating value.
7. Cash Conversion Cycle (CCC)
The cash conversion cycle metric is a measure of how many days a company’s operating working capital is tied up in operations before converted into cash.
The CCC encapsulates three key stages of a company’s operating cycle:
- The selling of current inventories.
- The collection of cash from current sales.
- The payment to suppliers or goods and services purchased.
The CCC is therefore calculated using three other operating working capital metrics:
- DIO - Days Inventory Outstanding
- DSO - Days Sales Outstanding
- DPO - Days Payable Outstanding
DIO and DSO are short-term assets, while DPO is classed as a liability.
The formula for calculating Cash Conversion Cycle (CCC) is:
CCC = DIO + DSO – DPO
The shorter the cycle, the quicker it can convert its invested operating capital into cash, through selling off its inventories, receiving payments from customers, while paying suppliers in a timely manner.
8. Days Inventory Outstanding (DIO)
The Days Inventory Outstanding metric is a measure of how many days on average a company holds inventory before sold.
The formula for calculating DIO is:
DIO = Inventory / Annual cost of goods sold (COGS) x 365
Looking at inventory performance as days rather than turns provides a deeper understanding of inventory management efficiency.
This is because inventory days can be directly compared to a company’s replenishment- or production lead-times.
Inventory days therefore help identify discrepancies between ideal inventory levels and the time it takes a company to restock or produce.
- A company’s DIO should always be evaluated against its ideal inventory level.
- A low DIO indicates that a company turns its inventory into sales at a high pace.
- A high DIO indicates that a company is not able to quickly turn its inventory into sales. This can be due to poor sales performance or the purchase of too much inventory.
9. Days Sales Outstanding (DSO)
The Days Sale Outstanding metric is a measure of how many days on average a company takes to receive payments for its sales.
The formula for calculating DSO is:
DSO = Accounts Receivable / Annual Sales x 365
Looking at accounts receivable performance as days rather than turns provides a deeper understanding of receivables management efficiency.
This is because receivables days can be directly compared to a company’s customer payment terms.
Receivables days therefore help identify discrepancies between contractual customer terms and the time it takes a company to collect its receivables.
- A company’s DSO should always be evaluated against its weighted average customer payment term.
- A low DSO indicates that a company can negotiate favorable payment terms with its customers, and that customers pay on time.
- A high DSO indicates longer customer payment terms, and/or that the company is experiencing delays in receiving payments.
10. Days Payable Outstanding (DPO)
The Days Payable Outstanding metric is a measure of how many days on average it takes a company to pay its suppliers.
The formula for calculating DPO is:
Looking at account payable performance as days rather than turns provides a deeper understanding of a company’s efficiency.
This is because payable days can be directly compared to a company’s supplier payment terms.
Payables days therefore help identify discrepancies between contractual supplier terms and the time it takes a company to pay its supplier invoices.
- A company’s DPO should always be evaluated against its weighted average supplier payment term.
- A low DPO indicates shorter supplier payment terms, or that the company is paying its suppliers earlier than required.
- A high DPO indicates that the company can negotiate longer supplier payment terms, and/or that the company is delaying its supplier payments.
Interpreting Working Capital Ratios and KPIs
Calculating KPIs is the easy part - the real value comes from interpreting them in context. A ratio by itself means little unless you understand what it tells you about the company’s liquidity, efficiency, and growth potential.
When reviewing working capital metrics, consider:
Industry and Business Model
- Different sectors have very different working capital needs.
- Example: Supermarkets often run with negative working capital (they sell goods before paying suppliers), while construction companies may have high DSO due to long project cycles.
Company Size and Growth Stage
- Startups may tolerate high DSO if it helps attract new customers.
- Mature firms usually target tighter working capital discipline to maximize free cash flow.
Seasonality and Cyclical Trends
- Retailers typically build up inventory (and OWC) before the holiday season.
- Agricultural businesses face cyclical swings tied to harvest and production cycles.
Trends Over Time vs. Snapshots
- A single period can mislead. A current ratio of 1.2 might look risky in isolation, but if it has improved steadily from 0.8, it signals progress.
- Tracking KPIs as a time series helps identify recurring patterns and long-term improvements.
Why this matters:
- Context-driven interpretation improves forecasting accuracy.
- Recognizing trends helps management act early on emerging risks or opportunities.
- It ensures decisions are made with a balance of liquidity, profitability, and growth in mind.
Takeaway:
Always ask: “Compared to what?” A KPI only gains meaning when viewed against industry benchmarks, business conditions, and its trajectory over time.
3 Questions to Ask When Interpreting a Working Capital KPI
1. Against What Benchmark?
- How does this KPI compare to industry peers, company targets, or historical averages?
- Example: A DSO of 60 days may be fine in construction but too high in software services.
2. What Is the Trend?
- Is the KPI improving, stable, or deteriorating over time?
- Example: A current ratio of 1.5 is healthy, but if it has been falling steadily from 2.5, it may signal rising risk.
3. What Action Does It Trigger?
- Does the result call for tightening credit control, adjusting inventory, or renegotiating supplier terms?
- Example: If DIO rises faster than sales, it may be time to review purchasing policies or product demand forecasts.
Limitations of Balance Sheet KPIs
Working capital ratios calculated from the balance sheet and P&L provide valuable insights - but they also have important limitations. By design, they offer only a snapshot, not the full story of how capital is used in operations.
These common Limitations include:
1. Mismatch between metrics
- P&L items (revenues, costs) don’t always align with balance sheet figures they are measured against.
- Example: Reported material costs reflect consumption, not purchases, so they may not match accounts payable levels.
2. Complex reporting structures
- Deciding which accounts to include can be subjective. Different teams may classify revenue and cost accounts differently, leading to inconsistent KPIs.
3. Periodic data distortion
- Balance sheets capture month-end or quarter-end figures only. Transactions between cut-off dates (e.g., late receivables or early payments) are not reflected, which can distort results.
4. Lack of granularity
- Ratios are averages. They may look “healthy” overall but mask big variations.
- Example: A DSO of 40 days may hide the fact that some customers pay in 10 days while others stretch payments to 90.
5. Slow trend detection
- Because balance sheet KPIs are often reviewed monthly or quarterly, sudden deviations can be missed.
- This makes it harder to spot emerging risks or opportunities (e.g., a new product line with slower receivables).
Why It Matters - these limitations can cause disconnects:
- Operational teams may feel KPIs don’t reflect reality, making it difficult to create ownership or urgency.
- Finance may see liquidity pressures too late if relying only on static ratios.
Despite their flaws, balance sheet metrics remain essential:
- External stakeholders (banks, investors, credit rating agencies) rely on them to assess financial health.
- Management uses them for high-level benchmarking, trend analysis, and scenario planning.
- They provide a common financial language across the company.
Best Practice: Combine with Transactional Data
To overcome these gaps, leading companies supplement balance sheet KPIs with transaction-level insights:
- Customer level receivables analysis → show which customers are driving DSO.
- Supplier-level payables analysis → reveal which terms are being stretched or paid early.
- Inventory turnover by product line → highlight where stock is moving too slowly.
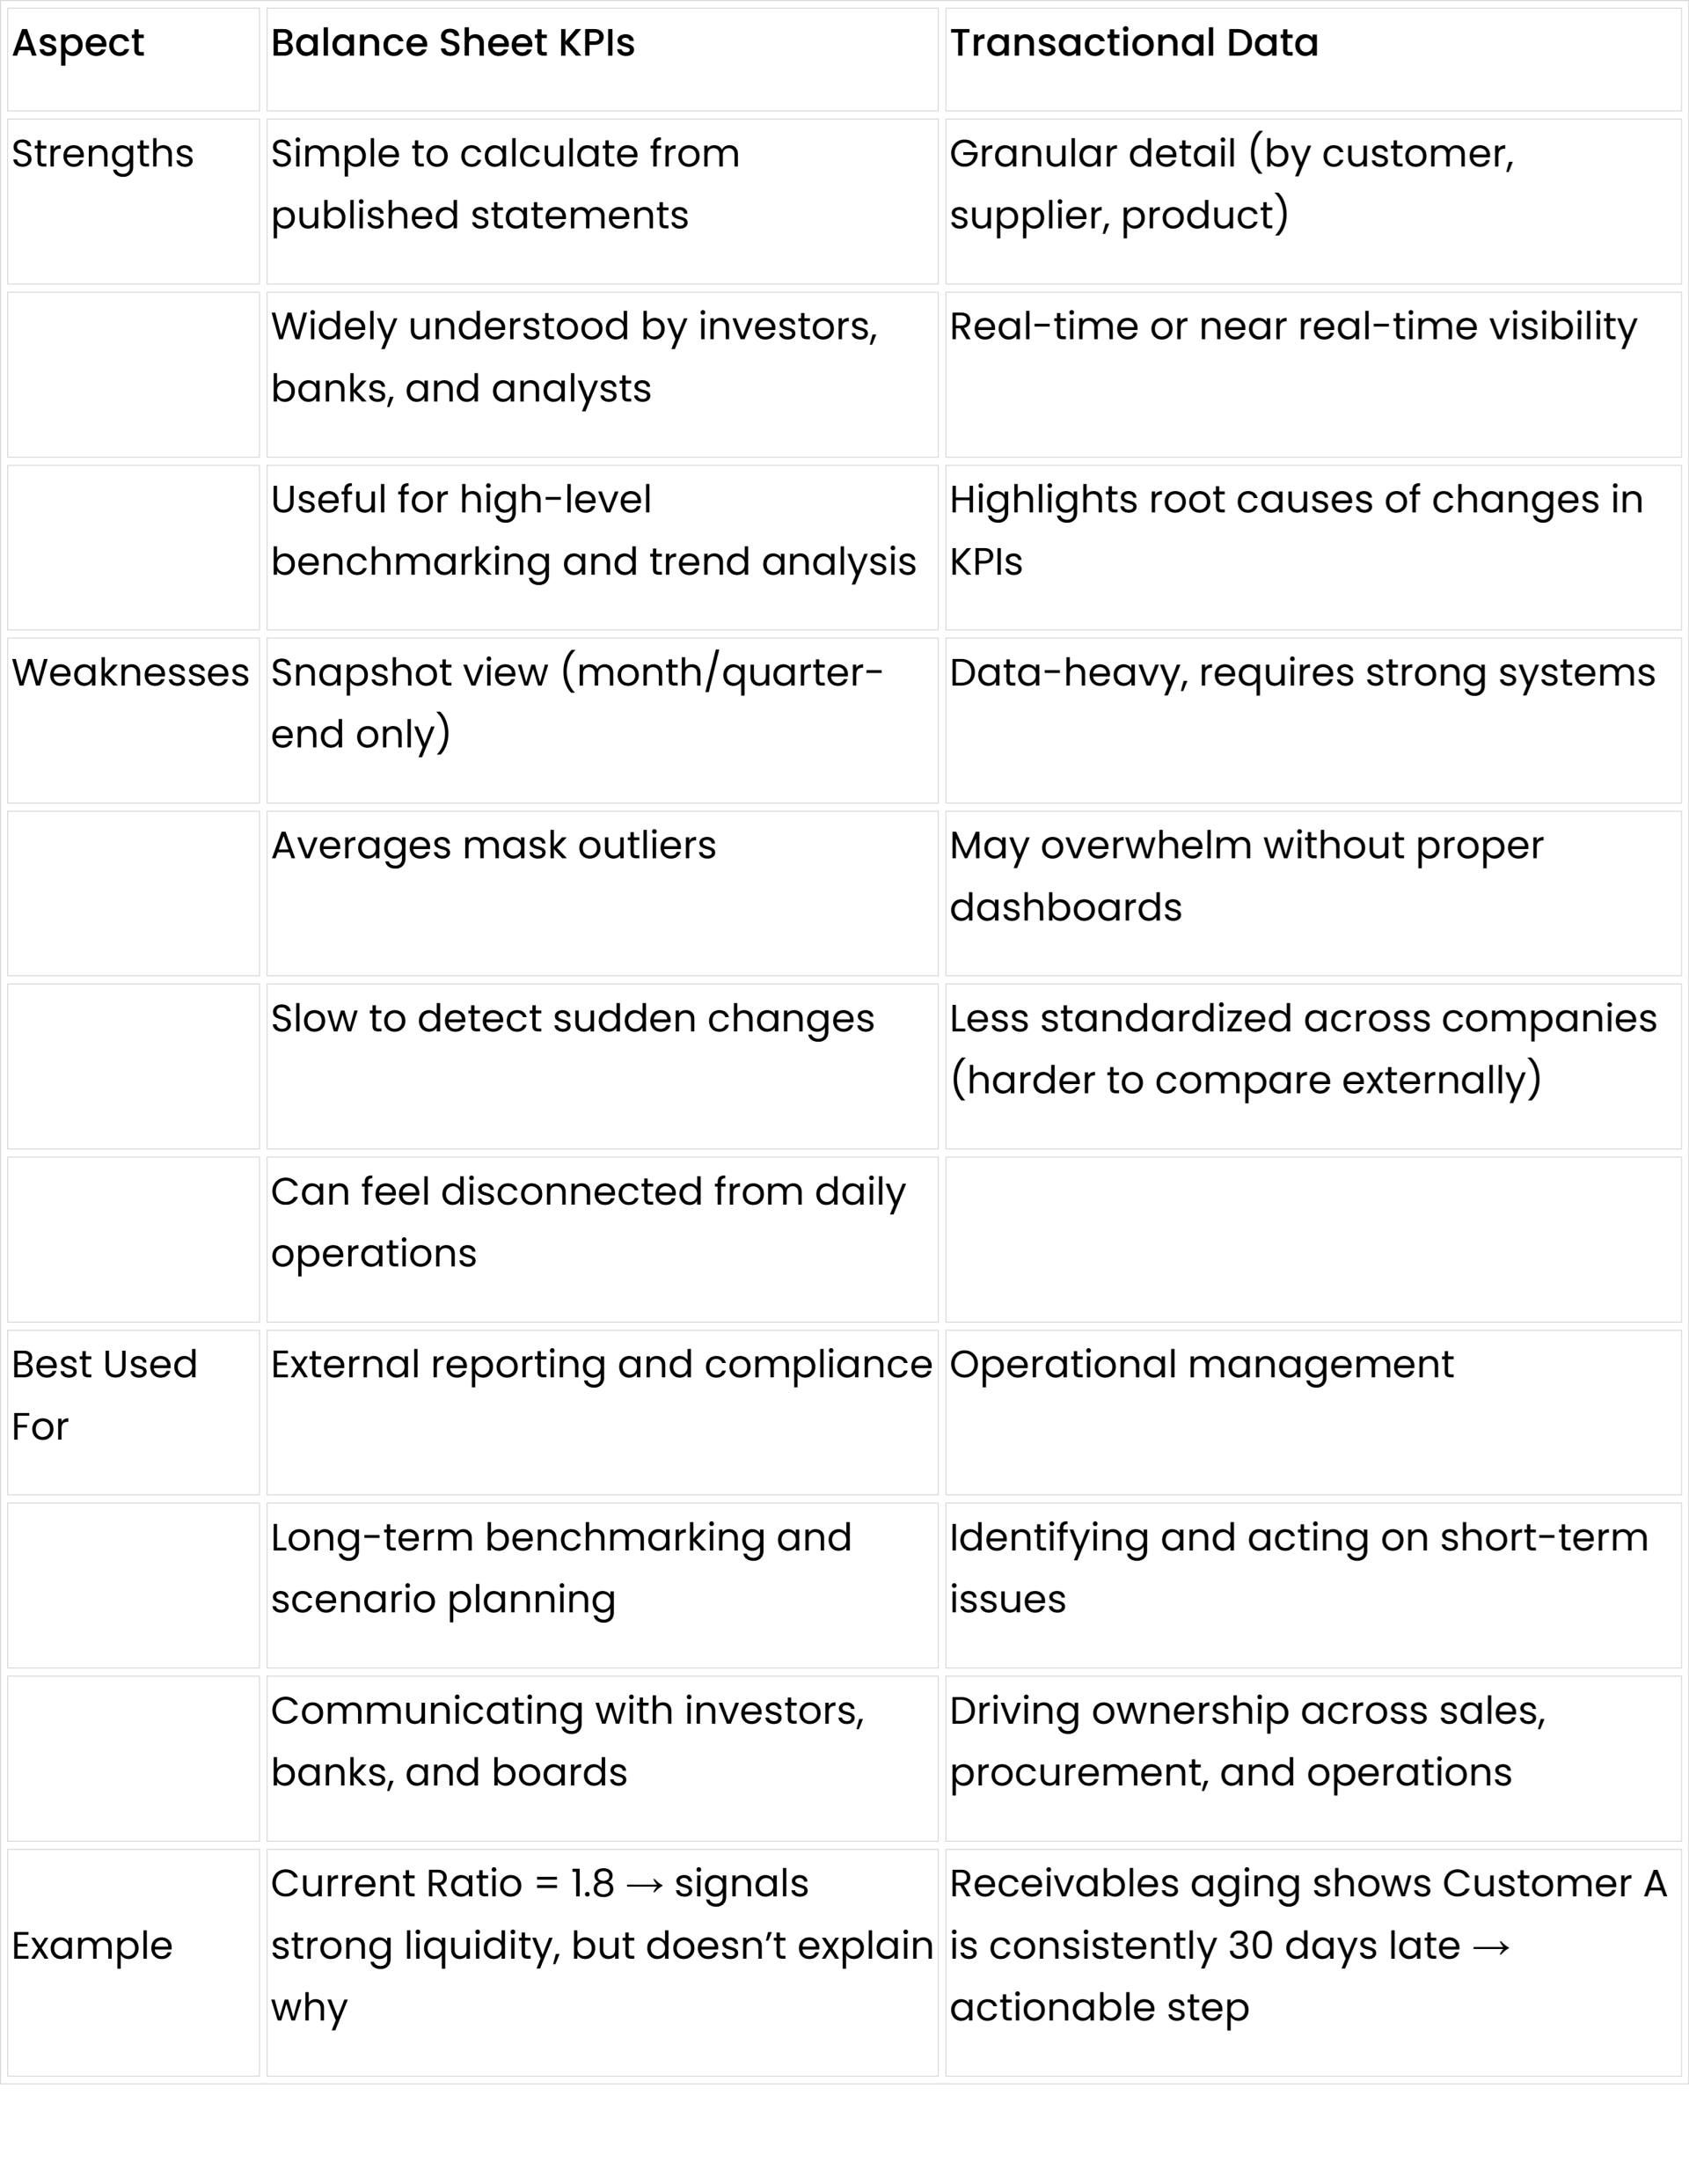
Takeaway:
Balance sheet KPIs are the helicopter view, but transactional data provides the ground-level detail needed to manage working capital effectively. Together, they enable resilience, innovation, and growth.
Conclusion
Working capital is more than an accounting measure - it is the engine of liquidity, efficiency, and growth.
By tracking both working capital and operating working capital, companies gain two critical views: the broad picture of overall liquidity and the detailed insight into daily operational efficiency.
- Key metrics and KPIs - from the Current Ratio and Quick Ratio to DSO, DPO, and the Cash Conversion Cycle - provide the foundation for assessing working capital health.
- Interpretation in context is essential. Industry dynamics, business model, size, and seasonality all influence what “good” looks like. Trends matter more than one-off snapshots.
- Balance sheet KPIs have limits. They give a necessary high-level view but can mask issues. To truly manage performance, companies must combine them with transaction-level analysis for real-time, actionable insight.
The takeaway is simple: measuring is only the first step.
True value comes when finance and operations leaders connect KPIs to action - freeing up cash, renegotiating terms, or optimizing processes.
Done well, working capital management not only keeps a business liquid, it fuels profitability, resilience, and long-term growth.
Take Your Next Step: Become a Certified Working Capital Expert with Working Capital Hub’s accredited online courses
Subscribe to our newsletter
Thank you!
Policy Pages
Copyright © 2025